Comparison results
| Results: Differences General | ✘Poisoning with silicon salts | ✘Poisoning with household chemicals | ||||
| Related research | Analogs | Analogs | ||||
| ||||||
| Distinctive symptoms | ||||||
| Register, to see more distinctive signs of diseases and studies | 96% | — | ||||
| Register, to see more distinctive signs of diseases and studies | — | 100% | ||||
| sulph | 90% | — | ||||
| headaches | — | 32% | ||||
| sore throat in the morning | 84% | — | ||||
| vomiting foam | — | 29% | ||||
| poisoning with narcotic analgesics | 81% | — | ||||
| acetone poisoning | — | 26% | ||||
| alkali poisoning | 80% | — | ||||
| effects of poisoning | — | 23% | ||||
| pain in the larynx | 74% | — | ||||
| poisoning with household chemicals | — | 22% | ||||
| throat tickling | 73% | — | ||||
| benzene poisoning | — | 21% | ||||
| vomiting in the morning | 73% | — | ||||
| nicotine poisoning | — | 21% | ||||
| posttransfusion complications | 69% | — | ||||
| tumor collapse syndrome | — | 20% | ||||
| increased blood clotting | 67% | — | ||||
| inquisitive | — | 19% | ||||
| serum sickness | 63% | — | ||||
| chemical burn | — | 18% | ||||
| throat hurts | 61% | — | ||||
| a lot of medicines | — | 18% | ||||
| increased | 61% | — | ||||
| esophagitis | — | 16% | ||||
| liver dysfunction | 60% | — | ||||
| no consciousness | — | 15% | ||||
| hemorrhagic diathesis | 56% | — | ||||
| consequences of taking medications | — | 14% | ||||
| causes vomiting | 70% | 16% | ||||
| patient's condition | — | 14% | ||||
| vomiting even from water | 70% | 16% | ||||
| disorders of consciousness | — | 13% | ||||
| liver problems | 51% | — | ||||
| caution | — | 13% | ||||
| up circulatory disorders | 50% | — | ||||
| 2 children | — | 13% | ||||
| blood diseases | 46% | — | ||||
| spicy food | — | 13% | ||||
| poisoning with silicon salts | 45% | — | ||||
| worse food | — | 12% | ||||
| tickling throat in the morning | 42% | — | ||||
| worse during meals | — | 12% | ||||
| general intoxication syndrome | 55% | 12% | ||||
| dyspnea | — | 12% | ||||
| convulsions | 52% | 12% | ||||
| nausea | — | 12% | ||||
| vomiting | 51% | 23% | ||||
| allergy | — | 11% | ||||
| intoxication | 100% | 77% | ||||
| cancer | — | 11% | ||||
| drug disease | — | 11% | ||||
| oncology | — | 10% | ||||
Instructions
Video 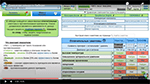
|