Comparison results
| Results: Differences General | ✘L92.2 | ✘M83 | |||||||
| Related research | Analogs | Analogs | |||||||
| |||||||||
| Distinctive symptoms | |||||||||
| Register, to see more distinctive signs of diseases and studies | 100% | — | |||||||
| Register, to see more distinctive signs of diseases and studies | — | 24% | |||||||
| eosinophilic granuloma | 95% | — | |||||||
| vitamin d deficiency | — | 22% | |||||||
| papules | 81% | — | |||||||
| pain in the bones of the lower leg | — | 15% | |||||||
| headache in schoolchildren | 76% | — | |||||||
| pain in the bones of the pelvis | — | 15% | |||||||
| radiation therapy | 67% | — | |||||||
| pain in the bones legs | — | 14% | |||||||
| radiation damage | 65% | — | |||||||
| enteropathy | — | 12% | |||||||
| cancer | 60% | — | |||||||
| intolerant gluten | — | 11% | |||||||
| swelling | 59% | — | |||||||
| sprue | — | 11% | |||||||
| patient's condition is satisfactory | 59% | — | |||||||
| pain in the shins | — | 10% | |||||||
| false joint | 59% | — | |||||||
| rickets | — | 10% | |||||||
| pathological fracture | 58% | — | |||||||
| food is poorly digested | — | 10% | |||||||
| pain when moving | 55% | — | |||||||
| pain in the ribs | — | 10% | |||||||
| oncology | 55% | — | |||||||
| chronic kidney failure | — | 9% | |||||||
| rashes on the face | 54% | — | |||||||
| lactation | — | 9% | |||||||
| bone defects | 51% | — | |||||||
| the body is not his | — | 9% | |||||||
| pedantry | 50% | — | |||||||
| malabsorption | — | 9% | |||||||
| worse from movement | 48% | — | |||||||
| pain in the legs | — | 8% | |||||||
| gradual deterioration of the condition | 47% | — | |||||||
| intestinal insufficiency syndrome | — | 8% | |||||||
| pain in the bones | 56% | 9% | |||||||
| metabolic disorder | — | 8% | |||||||
| onset of illness | 41% | — | |||||||
| worse food | — | 8% | |||||||
| childhood diseases | 40% | — | |||||||
| worse during meals | — | 8% | |||||||
| patient's condition | 38% | — | |||||||
| decreased concentration of attention | — | 8% | |||||||
| bone fracture | 47% | 8% | |||||||
| kidney failure | — | 8% | |||||||
| trauma | 40% | 7% | |||||||
| epilepsy | — | 8% | |||||||
| history of surgery | 37% | 6% | |||||||
| heredity predisposition | — | 8% | |||||||
| congestive kidney | — | 8% | |||||||
| diseases of the gastrointestinal tract | — | 7% | |||||||
| consequences of surgery | — | 7% | |||||||
| impaired kidney function | — | 7% | |||||||
| consequences of taking medications | — | 6% | |||||||
| lowered | — | 6% | |||||||
Instructions
Video 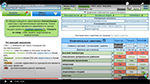
- Introduce new diseases through 🔍 Search and input on the top panel using
- The table shows the most important distinguishing symptoms, tests and diagnoses related to the selected diseases.
- The higher the percentage, the more important this symptom is for the disease and vice versa. At 0%, we can say that this symptom never occurs in the disease.
- The list changes dynamically depending on the data of the current visit in the selection of therapy .
- Click on the percentageto see the suggestions from the original source.
- By using the service, you agree to user agreement.